Download PDF Here
ABOUT OLAM
Established in 1989, Olam today is a leading global agribusiness operating from seed to shelf, supplying food and industrial raw materials to over 23,000 customers worldwide. Our purpose is to reimagine global agriculture and food systems and drive transformation in the sector by delivering on the following three outcomes: (1) creating prosperous farmers and farming systems; (2) enabling thriving communities; and (3) regenerating the living world.
WHY IS OLAM MEASURING LOSSES IN PALM OIL?
More than one-third of all the food produced globally intended for human consumption is lost from the point of harvest. One way to contribute to meeting the future global demand for food, and more generally raw materials, is by reducing losses through efficient management of upstream agricultural value chains.
No single third-party source can currently provide sufficient country-level data on losses to guide companies’ future investments and prioritization in crop and food loss reduction. This is an opportunity for food and agricultural companies to take the lead in quantification and establish industry and value chain baselines.
Olam’s CEO is part of Champions 12.3[1] and has committed to the Global Agribusiness Alliance Food Loss Resolution. Both coalitions focus on reducing losses by 50 percent by 2030. Olam also acts as co-lead of the World Business Council for Sustainable Development’s (WBCSD) Post-harvest Loss and Food Waste project. The project fosters value chain collaboration and peer learning on best practice and practical implementation of post-harvest loss and food waste strategies. Olam’s sustainability strategy in meeting these commitments is to focus on measuring, reducing, and repurposing losses of raw materials and by-products generated, by creating a company inventory for its directly-managed farms, processing and logistics operations, and working with targeted third-party supply chains.
Anticipated benefits from measuring what is not yet known include financial savings, resource-use efficiency, contribution to climate targets, greater food availability, and better return on investments for value chain actors involved. For operations under Olam’s direct management, the incentives are to reduce the cost of production per ton of product and create more units of product per land area under production. In third-party supply chains, addressing losses in collaboration with suppliers will benefit Olam’s procurement strategy, while enabling farmers to generate a better return on their investment and generate a higher income.
WHAT HAS BEEN YOUR EXPERIENCE WITH USING THE FLW STANDARD?
As part of its focus on implementing practices to optimize productivity, Olam’s palm oil operation in Gabon—Olam Palm Gabon (OPG)—quantified losses to establish a baseline across its directly managed operations, which include plantation production, transportation from plantation to mill, and mill processing. This was an opportunity to demonstrate the recovery efficiency for palm oil across all three stages.
Using the FLW Standard was helpful as it encouraged OPG to consider in greater detail the various points in the palm oil supply chain where losses might occur, and also helped the business think about how to describe the various streams of possible losses. For example, as an agricultural processor of raw materials, Olam generates large quantities of agricultural by-products. These “inedible parts”—as defined by the FLW Standard—are generated through multiple processing stages and considered a valuable resource. For additional details, see the “About by-products and their valorization” section.
WHAT ASPECTS SHOULD ONE TAKE INTO CONSIDERATION WHEN MEASURING FOOD LOSS AND WASTE IN PALM OIL PRODUCTION? HOW DID THIS INFLUENCE YOUR APPROACH TO QUANTIFICATION?
The raw material harvested to produce palm oil are fresh fruit bunches (FFB) from the oil palm tree. The amount of oil that an individual FFB yields depends on its ripeness. An unripe bunch and a ripe bunch can have the same weight, but the oil content of the ripe bunch will be higher. In palm oil production, losses are typically assessed with a focus on identifying how much oil could be recovered at each of different stages—production, transportation, and processing.
On the plantation, bunches are harvested according to certain standards—such as color and the number of loose fruits detached from the bunch. This helps ensure that FFBs are harvested at the optimal point of ripeness, which maximizes the oil content. For example, a minimum ripeness standard is applied during harvesting specifying that for bunches less than 15 kg, five fruits must be seen to have naturally detached themselves on collection platforms along the harvesting road. For bunches over 15 kg, the standard is 10 fruits.
On a large-scale plantation, a plantation block represents on average 30 hectares. In order to measure crop losses on the plantation, OPG conducts daily agronomy audits on 10 percent—that is, one palm row in every ten rows—of the blocks randomly selected for the assessment. It records the number of missed FFBs that meet the minimum ripeness standard, loose fruits uncollected by the harvesters, and FFBs attacked by pests or having gone mouldy on the tree due to overripeness.
In 2017, across OPG’s plantation estates, monthly crop losses based on agronomy audits ranged from an average of 36kg/ha to 178kg/ha for the Awala plantation and from 4.8kg/ha to 22.2kg/ha for the Mouila plantation. In order to convert the number of missed FFBs and loose fruits to weight (the metric required by the FLW Standard), OPG used an average estimated weight that was derived from the weight of FFBs delivered to the mill. Additional details on this calculation are in the “About the methodology” section.
Various factors can contribute to the level of OER. Some are manageable and are linked to crop freshness and ripeness standards, harvesting intervals, labor availability, training and supervision of harvesters. Other factors outside the control of operational managers include pollination, which determines the number of fruits in a bunch; hilly terrain on parts of the plantation; and seasonal climate variation. Very high rainfall also can damage the plantation roads and restrict access to parts of the plantation. As an example in November 2017, high rainfall of 412mm fell on the Awala plantation (especially in a hilly area), which led to exceptionally high crop losses in one division, estimated at 1,093 kg/hectare over an area of 146 hectares. In this case, applying a 22 percent OER to 159 tons of FFB not recovered and therefore lost, at a crude palm oil (CPO) price of US$649 per metric ton led to a potential financial loss of US$22,815 for that estate’s division in that month.
WHAT ACTION HAS OLAM TAKEN AS A RESULT OF MEASURING ITS FOOD LOSS AND WASTE?
Prior to this study, OPG was already minimizing losses through rigorous procedures, which included the following:
- On the plantation, OPG engages in continuous training and enhanced supervision of harvesters, with day-to-day management and upkeep of plantations. In 2018, OPG developed Agripal, a mobile app designed to reduce crop losses by recording real-time data on harvested, evacuated, and uncollected bunches with a geotagging functionality traced back to individual harvesters and exact location of backlogs (uncollected bunches). On a large-scale plantation, since a block represents on average 30 hectares, it is not only time-consuming to identify where the backlog is located when information is just logged manually without exact GPS coordinates, but it can also lead to crop losses that could be prevented.
- During transportation from the field to the mill, the load of FFBs are protected with a security net, which prevents losses. The security net is then removed just before the load is offloaded into the FFB mill hoppers.
Since the mill began operating, OPG has been tracking data on weight of FFBs delivered to the mill and volume of oil processed. Regular recordkeeping—as well as the implementation of best practices such as training staff on harvesting standards, conducting agronomy audit samples to measure field losses after harvesting, and shorter sterilization cycles—all contribute to minimizing operational losses.
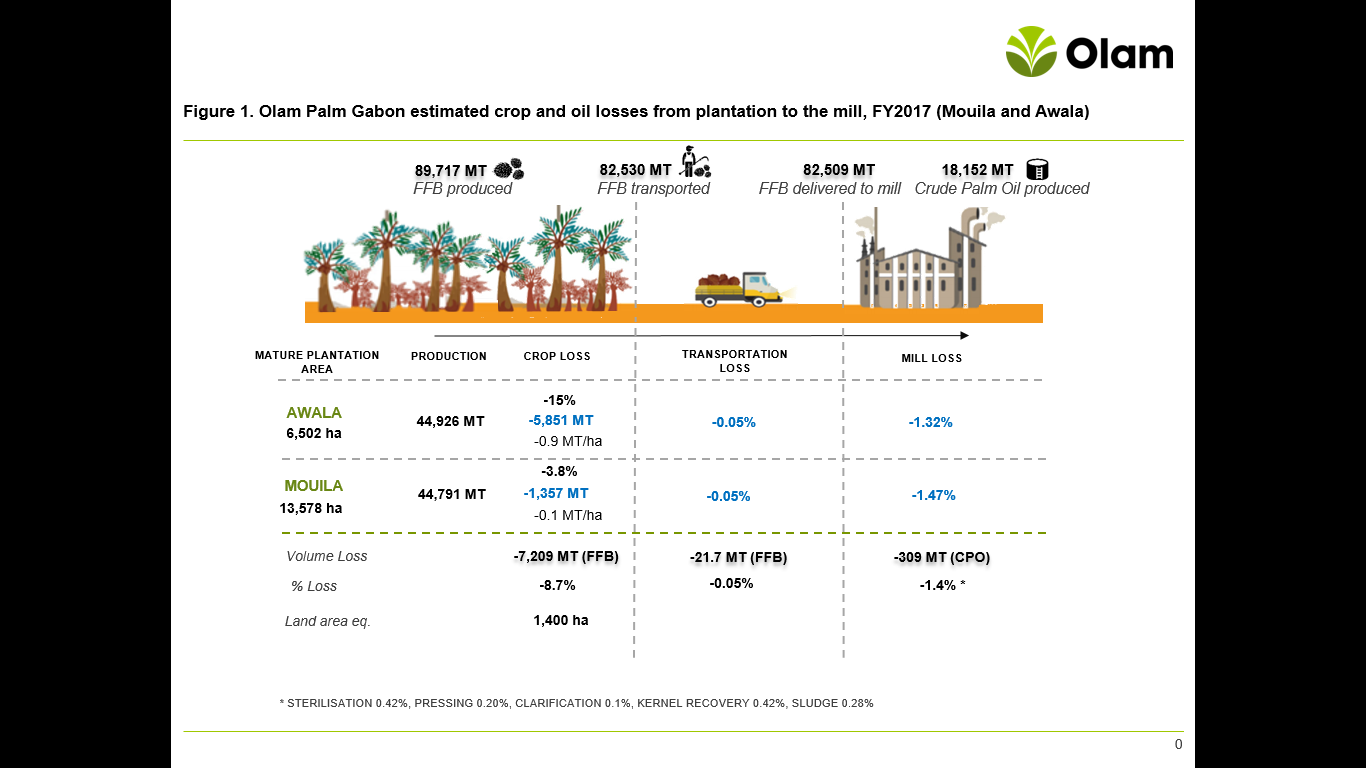
In light of management practices adopted by OPG, losses in 2017 were measured as follows in each of the three stages (Figure 1).
- On the plantation, crop loss is estimated by weight based on agronomy audit sampling. In 2017, 0.9 MT/ha/year and 0.1 MT/ha/year of total crop loss were identified in Awala and Mouila respectively, with total OPG crop loss estimated at 0.4 MTt/ha/year or approximately 8.7 percent of produced yield over 20,080 hectares of early maturing fields. This represents an opportunity to further minimize crop losses from the plantations and optimize the oil yield in harvested FFBs by meeting OPG’s optimum ripeness standard.
- Transportation losses, initially assumed to be minimal, were sampled for this case study and confirmed as extremely low, with only 05 percent of FFB (by weight) loaded on trucks lost in transit from the field to the mill.
- For OPG’s mills, the annual loss rate was 1.32 percent of total crude palm oil (CPO) produced at one mill and 1.47 percent at the second mill, which meets the industry target of 1.5 percent for accepted losses.
Across all three stages, this equates to 9.64 percent loss based on 89,717 metric tons of FFB produced at both Awala and Mouila plantation sites in 2017.
Olam will be using what it has learned from this quantification exercise to guide measurement on losses across its other plantations, farms, and concessions.
Source: Olam.
WHAT IS INCLUDED IN THE SCOPE OF THIS FLW INVENTORY?
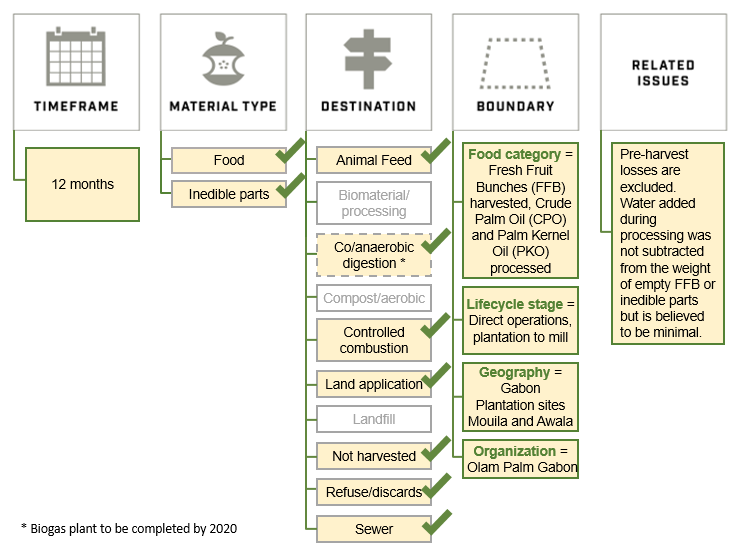
Figure 2 visually represents the scope of OPG’s loss inventory using the FLW Standard for its two Gabonese plantations and processing sites. While all possible types of destinations were assessed in the inventory, material only goes to seven: animal feed, co-anaerobic digestion, controlled combustion, land application, left unharvested, sewer/wastewater treatment, or as discards (left on the road). The categories included were palm fresh fruit bunches, palm fruits, crude palm oil (CPO), and palm kernel oil (PKO), as well as by-products created during processing (see additional details in the “About by-products and their valorization section”).
Figure 2. Scope of Olam Palm Gabon’s loss inventory using the FLW Standard
HOW DOES THIS INVENTORY MEET THE FLW STANDARD‘S REQUIREMENTS?
The table below provides a summary of how this FLW inventory meets the eight reporting and accounting requirements contained in the FLW Standard.
| FLW STANDARD REQUIREMENTS & DESCRIPTION OF OLAM FLW INVENTORY
(see www.FLWProtocol.org for details and guidance) |
| 1. Base FLW accounting and reporting on the principles of relevance, completeness, consistency, transparency, and accuracy
· Relevance: All palm plantations under production and processing facilities owned by OPG were evaluated to quantify crop (FFB) and product (crude palm oil and palm kernel oil) losses. · Completeness: Losses were quantified from point of harvest to processing mill. · Consistency: For plantation losses, direct measurements were conducted as part of the daily agronomy audits on harvested plantation blocks; for transportation losses, sample analyses were undertaken on usual truck routes; and for milling stages, records on losses were provided. · Transparency: Destinations of losses were clearly started for all three value chain stages in scope: agricultural production, transportation, and milling. · Accuracy: Except for the transportation stage, plantation and mill records are consistent and part of a continuous reporting process. |
| 2. Account for and report the physical amount of FLW expressed as weight
Loss is reported in metric tons |
| 3. Define and report on the scope of the FLW inventory (FLW Standard includes additional details)
Timeframe: Data reported from January 2017 to December 2017 Material type: Food and inedible parts Destination: All possible types of destinations were assessed in the inventory. However, only animal feed, co/anaerobic digestion, controlled combustion, land application, left unharvested, sewer/wastewater treatment, or discards (left on the road) were considered as destinations for losses. Residual oil is absorbed by the inedible parts during processing (e.g., by the stalk during the sterilization process and the plant’s fibers during separation of the fruits from the bunches.) Boundary: · Food category: Palm oil (fresh fruit bunches, palm fruits, crude palm oil, and palm kernel oil), GPC Classification: Brick: 10000040 – Oils Edible– Vegetable or Plant (Shelf Stable) · Lifecycle stage: Direct operations, 3 stages 1. Growing of oil palm (ISIC code 0126 for oleaginous fruits) 2. Land transport, other (ISIC code 492) 3. Milling/manufacture of palm oil (ISIC code 1040 for vegetable and animal oils and fats) · Geography: Gabon, UN Country Code 266 (plantation sites: Mouila and Awala) · Organization: Oil Palm Gabon (two palm plantations, two milling processing facilities, and five truck transportation routes) Related issues: Pre-harvest losses are excluded. Water added during processing was not subtracted from the weight of empty FFBs or inedible parts, but is believed to be minimal. |
| 4. Describe the quantification method(s) used. If existing studies or data are used, identify the source and scope
· Direct counting and weighing · Records |
| 5. If sampling and scaling of data are undertaken, describe the approach and calculation used, as well as the period of time over which sample data are collected (including starting and ending dates)
Agronomy audits and estate reports are conducted daily to account for missed bunches and loose fruits left unharvested or uncollected. The audits are undertaken on a sampling of harvested plantation blocks. Only 2 of the 5 routes used by trucks transporting FFB were assessed. Additional details are included in the “About the methodology” section. At the mill, daily records are kept for each processing stage. |
| 6. Provide a qualitative description and/or quantitative assessment of the uncertainty around FLW inventory results
See “About the methodology” and sources of uncertainty described |
| 7. If assurance of the FLW inventory is undertaken (which may include peer review, verification, validation, quality assurance, quality control, and audit), create an assurance statement
Not applicable |
| 8. If tracking the amount of FLW and/or setting an FLW reduction target, select a base year, identify the scope of the target, and recalculate the base year FLW inventory when necessary
2017 was selected as the baseline year |
ABOUT THE METHODOLOGY
The following table provides additional details on the quantification methods used to gather data at different stages as well as the sources of uncertainty.
| Stage | Quantification methods used | SOURCES OF UNCERTAINTY |
| Plantation | For plantation crop losses, direct counting is conducted as part of the daily agronomy audits post-harvest. A sample of unharvested or uncollected loose fruits and missed bunches is recorded.
This total is multipled by the average FFB bunch weight for that truck’s load. The average weight is based on the actual weight of FFBs from the sampled area received at the mill.
The calculation therefore is as follows for crop loss: Number of uncollected loose fruits and missed bunches recorded multiplied by the average bunch weight for that truck for the sampled area. The percentage of losses is calculated based on the weight of FFBs delivered to the mill on an annual basis. |
Crop losses (by weight) are estimated, as there is no direct weighing of bunches on the plantation.
Crop losses are indicative, as sampling only takes place on randomly selected blocks with one agronomy auditor per block and per day. Sampling is conducted one or two days after the harvesting of FFBs and collection of loose fruits, on one row out of every ten rows of palm. The sample taken may not be fully representative of the entire plantation.
|
| Transportation | Samples were taken on two out of the five usual truck routes to assess transportation losses from the plantation to the mill.
Losses were quantified by counting the number of uncollected loose fruits that did not get loaded on the transportation truck. Losses are mainly due to the ripe fruits detaching themselves in the process of loading the truck. |
The monitoring of losses during transportation is not a regular procedure and was only conducted for the purpose of this case study, yet uncertainty in the results is low.
|
| Mill | FFB weight and oil weight are direct measurements.
At mill entry, the loaded truck goes on a scale and the total FFB weight is recorded, along with the number of bunches, time of dispatch, vehicle number, and block number.
At each processing stage in the mill (i.e., sterilization, pressing, clarification, kernel recovery, and sludge), oil losses are sampled and lab tested. Records on oil losses are maintained daily and consolidated monthly. |
None |
| By-products (i.e., inedible parts; not intended for human consumption) | For all by-products generated through the processing stages, records are based on actual weight and volumes tracked daily at the mill. The by-products tracked are: palm kernel expeller, actual palm kernel shell and fiber, empty fruit bunches, and actual palm oil mill effluent. | None |
ABOUT BY-PRODUCTS AND THEIR VALORIZATION
By-products are generated when FFBs enter the mill and are processed. The volumes are tracked and quantified at the mill because they are inputs that provide value for other parts of the business. Valorization of by-products is a key component of Olam’s Waste strategy. For this inventory, Olam looked at the following “inedible parts” and identified their destinations:
- Palm kernel expeller (PKE), a by-product of the crushing and expelling of oil from palm kernel, with a high fiber content and a source of protein widely used in ruminant diets, is currently sold in small quantities as animal feed as OPG has yet to secure a more permanent buyer. Most of the PKE generated by OPG is applied on plantation fields.
- Palm kernel shell (PKS) and fiber, a biomass residue generated after the crushing process, is burned for fuel as part of controlled combustion to generate steam in the mill.
- Empty fruit bunches (EFBs) are what remains of the FFBs after the fruit has been removed for oil pressing (25 metric tons of FFB produces 5 metric tons of EFB). After the processing, EFB is collected from the mill hopper and directly applied to the plantation fields (40MT/ha) to provide oil palms with nutrients, increase organic matter content in the soil, and reduce fertilizer costs. Raw EFB has a higher water retention capacity and is therefore purposefully not composted by OPG.
- Palm oil mill effluent (POME), a wastewater generated from the sterilization and clarification processes in milling oil palm, is captured and stored in anaerobic ponds and will be converted into energy by a biogas plant that is expected to be completed by 2020. POME will also be used for land application, channelled by irrigation canals as a nutrient-rich solution.
ABOUT THIS CASE STUDY
This case study is part of a series that shows how companies and others are using the FLW Standard to measure and reduce food loss and waste. Find more case studies online at www.FLWProtocol.org.
ABOUT THE FLW STANDARD
The Food Loss and Waste Accounting and Reporting Standard (or FLW Standard) helps companies, countries, cities and others quantify “food loss and waste”—what to measure and how to measure it—and encourages consistency and transparency in the reported data.
A summary of definitions and requirements of the FLW Standard can be found online along with related tools to help users report the scope of their inventory and select a method for quantification.
ABOUT THE AUTHORS
This case study was submitted by Vanessa Maire and Audrey Lee (Olam) with input and review by Brian Lipinski and Kai Robertson (representatives of WRI), as well as Ruth Thomas and Melanie Levine (representatives of Global Agribusiness Alliance at WBSCD, FLW Protocol Steering Committee member).
ABOUT THE FOOD LOSS AND WASTE PROTOCOL
The Food Loss & Waste Protocol (FLW Protocol)—a multistakeholder partnership— has developed the global Food Loss and Waste Accounting and Reporting Standard for quantifying food and/or associated inedible parts removed from the food supply chain—commonly referred to as “food loss and waste” (FLW). World Resources Institute (WRI) serves as the FLW Protocol’s secretariat.
For questions, please contact flwprotocol@wri.org.
Published: July 2019
[1] Champions 12.3 is a coalition of executives from governments, businesses, international organizations, research institutions, farmer groups, and civil society dedicated to inspiring ambition, mobilizing action, and accelerating progress toward achieving the Sustainable Development Goal (SDG) Target 12.3 by 2030. SDG 12.3 calls for halving per capita global food waste at the retail and consumer levels and reducing food losses along production and supply chains, including post-harvest losses.